
General information
The window Analysis in the module Plan offers tools to analyse and compare plans. The analyses include operative and financial evaluations. Please note that you will only be able to analyse plans which ran successfully (more information in Plan).
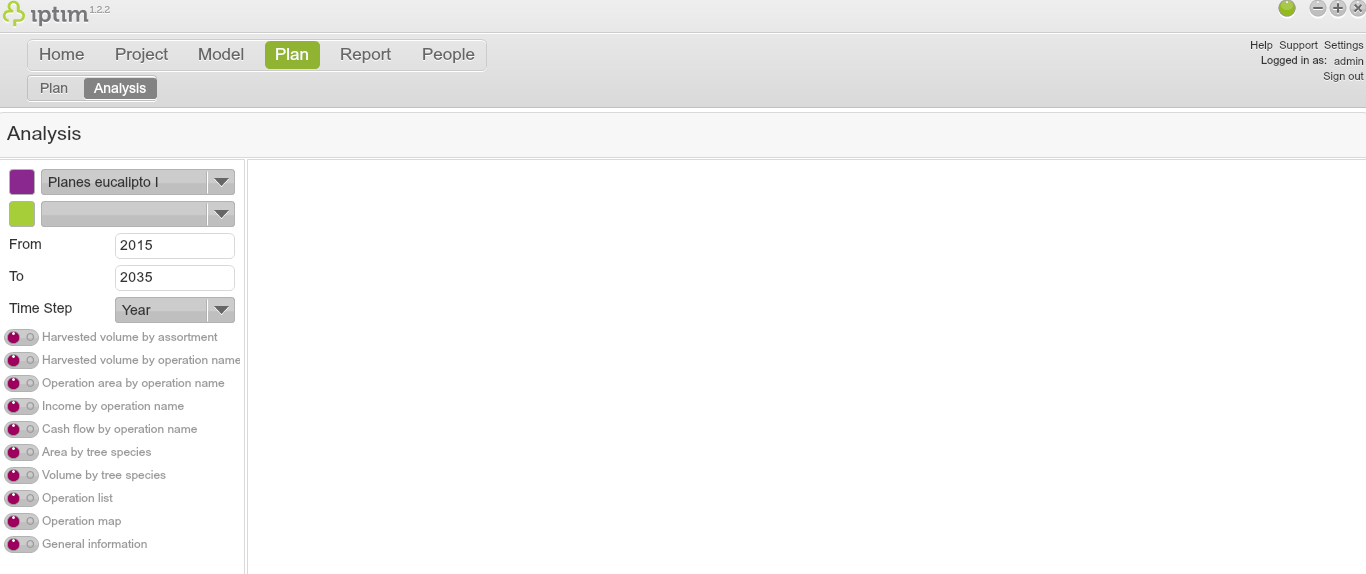
The main view of Analyze window.
__
Selecting plans to analyse
To select a plan to analyse:
- Click on the Analysis window in the Plan module.
- Click on the first drop-down menu on the left side of your screen and choose a plan to analyse.
- Click on the second drop-down menu and choose another plan to analyse (optional).
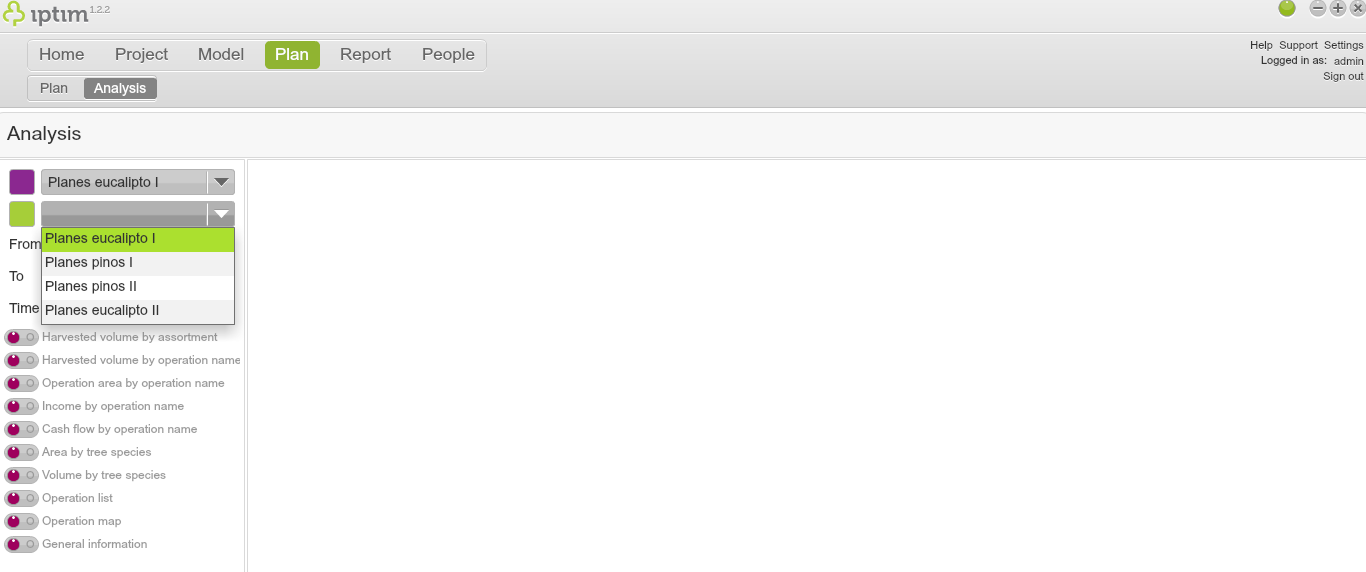
Selecting plans to analyse and compare.
__
Analyzing plans
To analyse a plan:
- Click on the Analysis window in the Plan module.
- Select plan(s) to analyse (see above).
- Modify the From and To dates to set the period of analysis.
- modify the Time step by clicking on the drop-down menu (optional).
- Use the switch buttons corresponding to the analysis which you wish to obtain.
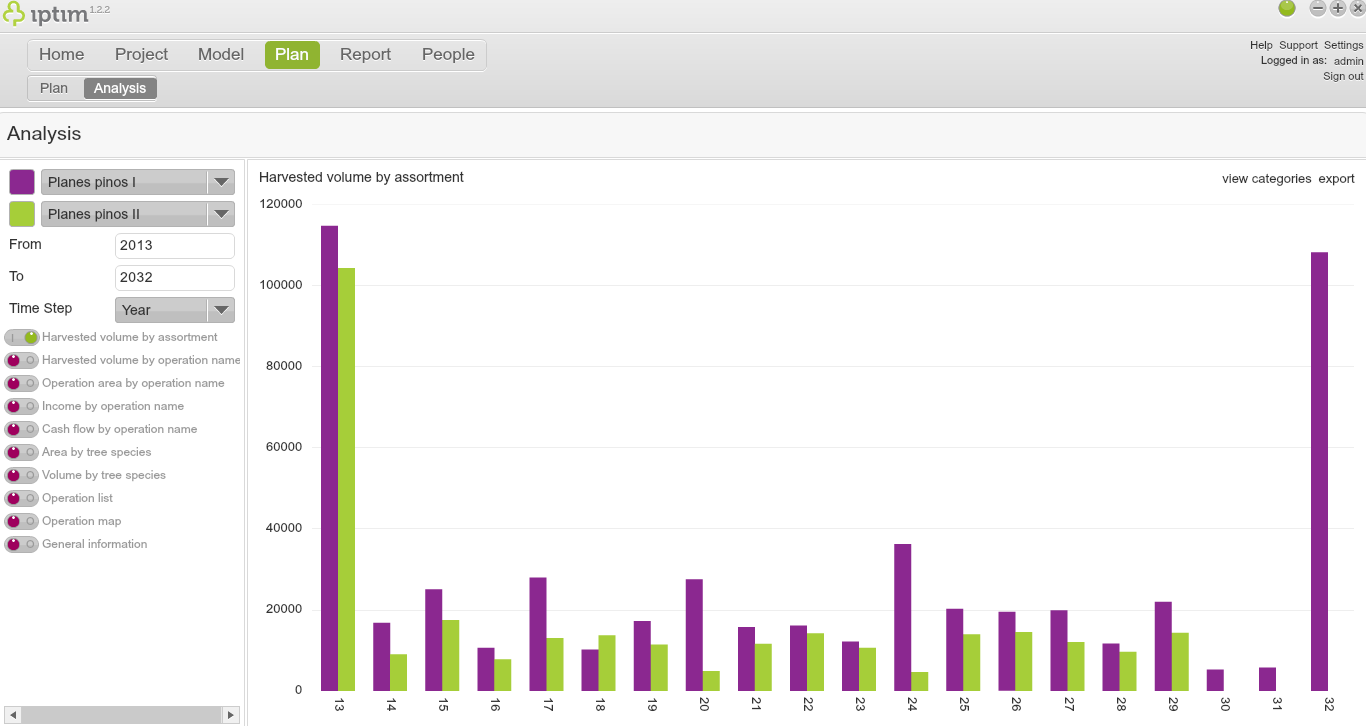
View of 'Harvested volume by assortment' analysis.
__
Totals view vs. categories view
Most analyses offer two views: (i) totals and (ii) categories. To navigate between each view:
- Click on the Analysis window in the Plan module.
- Select a plan to analyse (see above).
- Turn on the switch button Harvested volume by assortment. A graph will appear on the right side of your screen. This graph will appear in the 'totals view'.
- Click on view categories on the upper right side of your screen. The categories view will open.
- Click on view totals on the top right side of your screen to return to the totals view.
Button to change to the categories view.
__
Exporting reports and lists
- Click on the Analysis window in the Plan module.
- Select a plan to analyse (see above).
- Turn on the switch button Harvested volume by assortment. A graph will appear on the right side of your screen.
- Click on export on the upper right side of your screen.
- Choose a folder and save the report.
Button to export reports.
__
Operation lists
A vital analysis offered by Iptim is the generation of optimised operations lists for each stand. This analysis presents the dates in which each operation on each stand should be conducted to optimise the plans. To revise an operation list:
- Click on the Analysis window in the Plan module.
- Select a plan to analyze (see above)
- Turn on the switch button Operation list. The operations to conduct on each stand appear on the right hand side.
- Click on Open on the column operations. The operations of the corresponding stand will appear.
- Click on Open on the column assortments corresponding to a thinning or clearcut operation. The specific specie and assortment will appear with the corresponding volume.
- Click on Back in the lower left side of the window to return to the previous view.
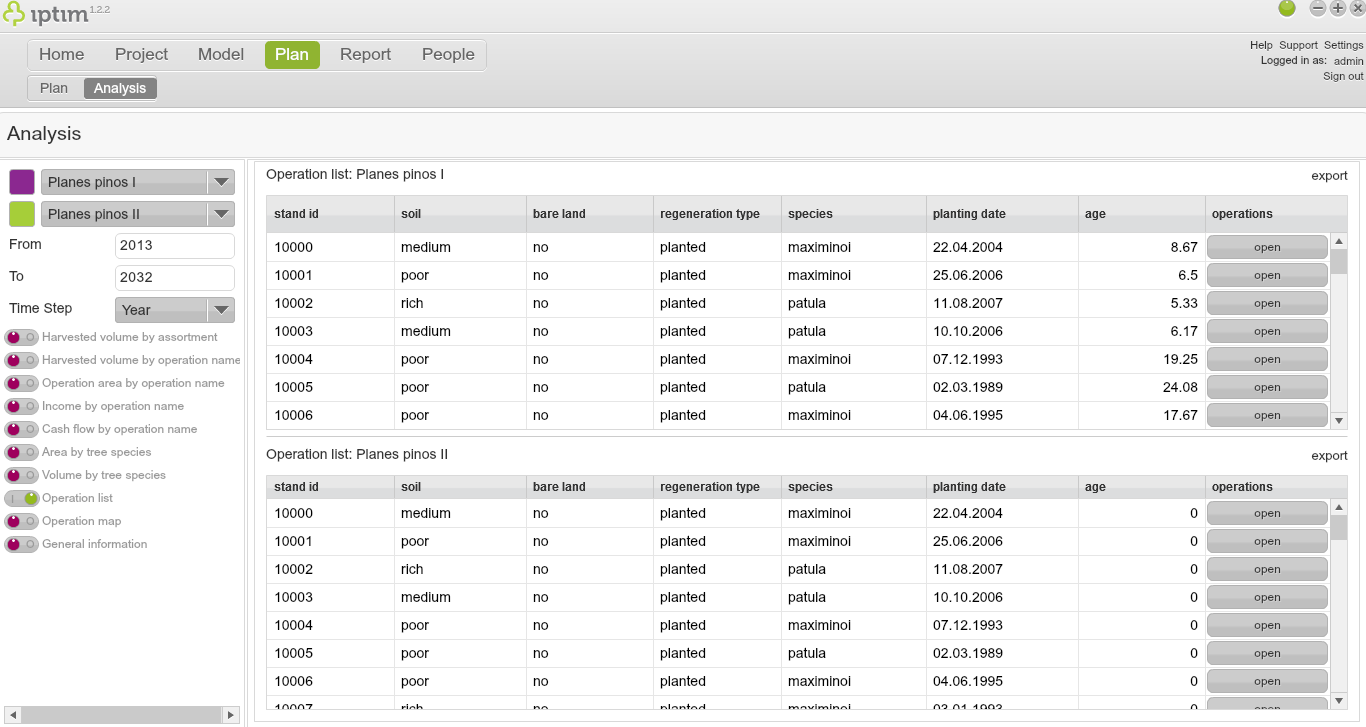
View of operations lists showing the operations of two projects.
__
Operation maps
Iptim offers a visualisation of the change in operations on each stand through time:
- Click on the Analysis window in the Plan module.
- select a plan to analyse (see above)
- Turn on the switch button Operation map. A map will appear on the right side of the screen. The map includes menus on the right-hand side which allow you to select the operations which you would like to follow in the time steps. Also, the map offers options to zoom and hide/visualise layers.
- Click on the play (triangle) button on the upper left the side of the map. This will allow you to see the change of operations in the stands through time.
- Click on the rewind and forward buttons (triangles) on the upper right part of the map to rewind and forward through the time steps.

Operation map view.
- Harvested volume by assortment.The 'totals view' shows the total harvested volumes in each period. The 'categories view' shows this information and highlights the corresponding assortments.
- Harvested volume y operation name. The 'totals view' shows the total harvested volume on each period. The 'categories view' shows information and highlights the types of operations.
- Operation area by operation name. The 'totals view' shows the total area in which operations are conducted in each period. The 'categories view' shows this information and highlights the type of operations which are conducted.
- Income by operation name. The 'totals view' shows the amount of income on each period. The 'categories view' shows this information and highlights the type of operation which was conducted to obtain that income (thinning, clear cut).
- Cash flow by operation name. The 'totals view' shows the resulting cashflows for each period. The 'categories view' shows the income and expenses and highlights the operations which incurred on these incomes and expenses.
- The area by tree species. The 'totals view' shows the total amount area with standing trees on each period. The 'categories view' shows this information and highlights the species on each area and period.
- Volume by tree species. The 'totals view' shows the total volume corresponding to the standing trees on each period. The 'categories view' shows this information and highlights the species which correspond to those volumes.
- General information. This window shows information on the total area, net present value (NPV), NPV per unit of area, and average annual cash flow for each plan which is being analysed.
Comments
0 comments
Please sign in to leave a comment.