
General information
The window Summary in the module Project allows you to examine your data with the use of various tools. These tools enable further insight and, in certain cases, the identification of data outliers. The window has two views, namely summary and relationships.
Please note that to view the Summary view, one or more data sets must be loaded. More information in Project browser.
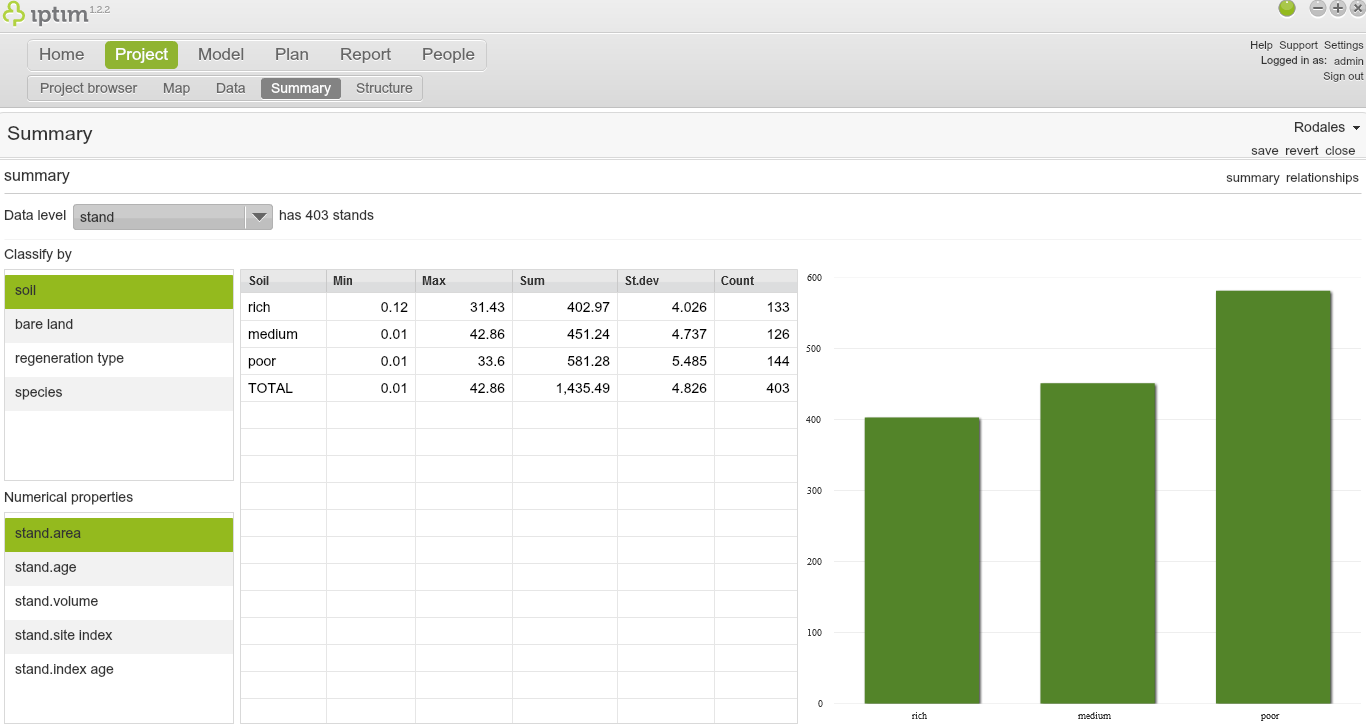
Vista de Resumen de proyectos.
__
Switching between the summary and relationships views
By default, you will see the summary view when opening the Summary window. To switch to the relationships view:
- click on the window Summary in the module Project.
- click on the relationships button on the right hand side of your screen.
- to return to the summary view, click on the summary button.
Button to change to the relationships view.
__
Summary view
The summary view allows users to observe and analyze data according to various variables. To view data in the summary view:
- click on the window Summary in the module Project.
- make sure that you are in the summary view by clicking in summary on the right hand side of your screen.
- click on the Data level drop down menu and choose a data level.
- click on an option in the Classify by section. You can classify various variables by holding the key 'Ctrl' (in Windows) or 'cmd' (in Mac).
- click on an option in the Numerical properties section.
- you can hover your cursor over the graph to related information.
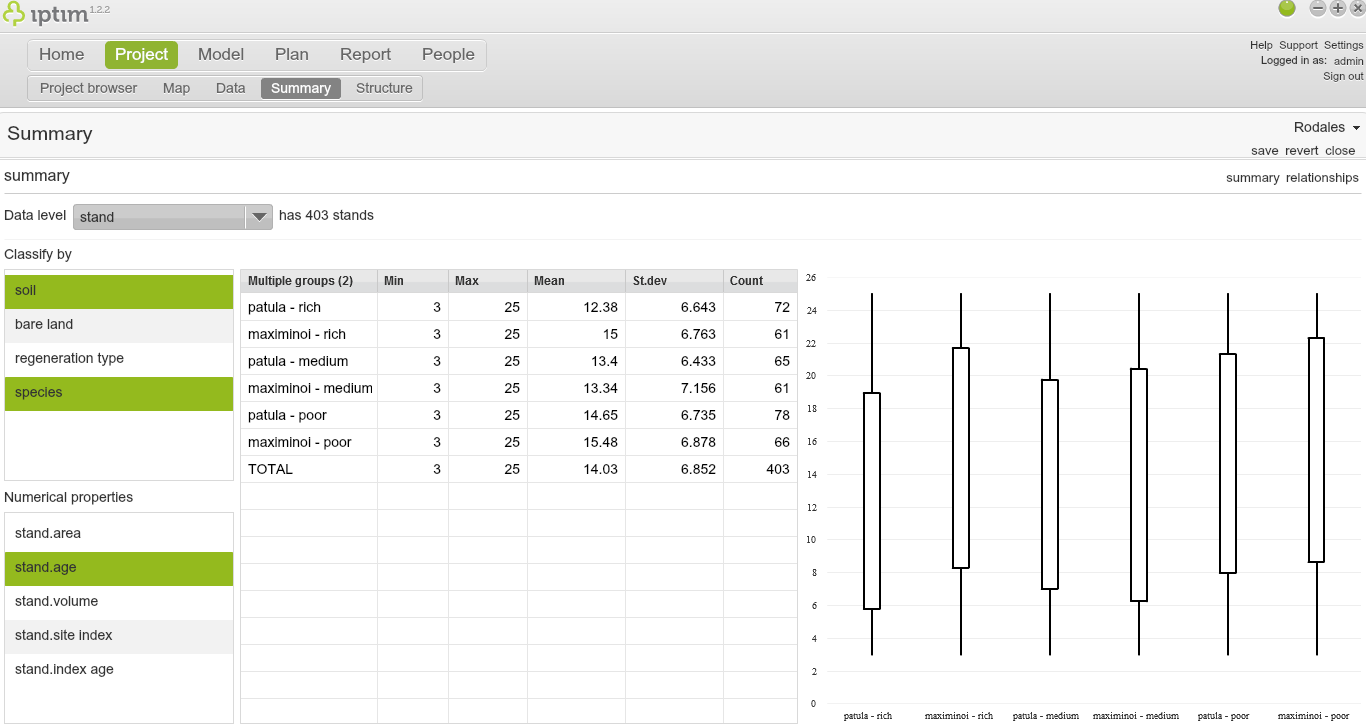
Summary view showing multiple selections in the 'Classify by' section.
__
Relationships view
The relationships view allows users to examine relationships between variables. This view may allow the identification of possible outliers. To analyze data in the relationships view:
- click on the window Summary in the module Project.
- make sure that you are in the summary view by clicking in relationships on the right hand side of your screen.
- click on the Data level drop down menu and choose a data level.
- click on the X-axis attribute drop down menu and choose an attribute.
- click on the Y-axis attribute drop down menu and choose an attribute.
- click on the Categories drop down menu and choose a category.
- you can click on a point in the graph to observe related information. It is possible to modify this data by double clicking on a cell in the bottom part of your screen.
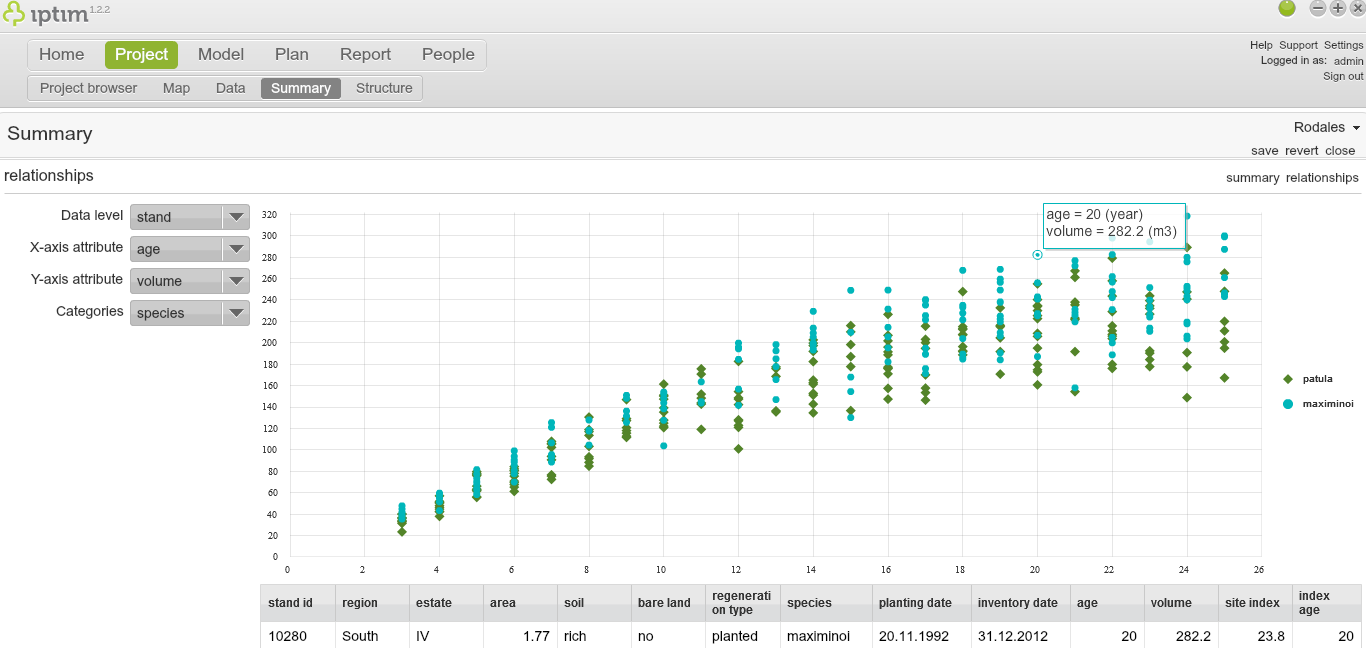
Relationships view with a selected point.
__
Switching between data sets
When more than one data set has been loaded, the user can switch between the data sets:
- click on the window Summary in the module Project.
- click on the data set on the upper right part of your screen. All loaded data sets will appear.
- click on the data set that you wish to open.
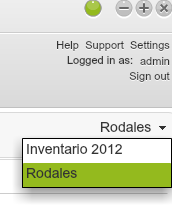
Switching between data sets.
Comments
0 comments
Please sign in to leave a comment.