
General information
The window Map in the module Project allows users to visualize spatial data, apply theme layers, and modify data. The Map window allows users to observe not only their stands but also the number of sample plots in each stand; the latter displayed in points and numbers as can be observed in the image below.
Please note that to view the Map window, a spatial dataset must be loaded. More information in Project browser.
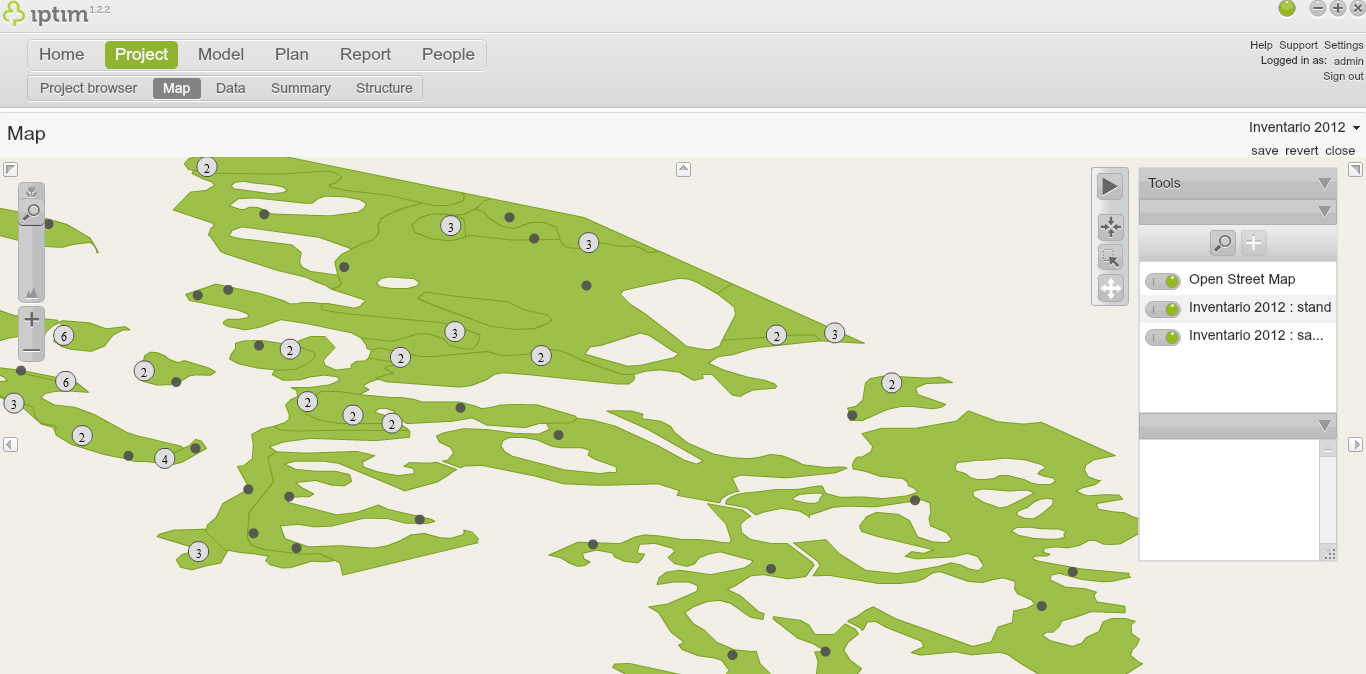
Map view showing stands and the sample plots within each stand.
__
Zoom
To make zoom in a map:
- Click on the window Map in the module Project.
- Use both bars on the left-hand side of your screen to zoom in and out. The bar on the top uses a scale which appears when clicking on the icon in the shape of a magnifying glass.
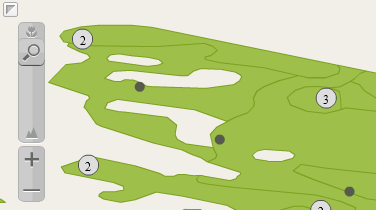
Zoom tools.
__
Centering the map
The button to center the map can be found on the right hand side of your screen.

Button to center the map.
__
Observe and modify data
To observe and modify data:
- Click on the window Map in the module Project. On the right hand side of your screen you can find a list of layers corresponding to the data levels of your data sets.
- Click on a level containing data (e.g. sample plot).
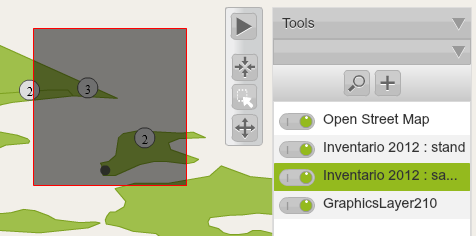
- Click on the selection tool (you can hover over the buttons to see each name. You can also see the image below).click on the map and drag the mouse over the area corresponding to the data that you wish to observe. A new window displaying the data will be opened.
- If you wish, you can modify the data by double-clicking on the corresponding cell.
Add theme layers
You can add theme layers to visualize distributions and classifications of your data. To add a layer:
- Click on the window Map in the module Project.
- Click on one of the layers on the Toolbox on the right hand side of your screen; e.g. one including stand level data.
- Click on the button + (Add a new theme layer). A new window will appear.
- Click on Property and choose a property to classify from the drop-down menu. You can modify the colors and values by double-clicking on them.
- Click on Classify.
- Enter a Name for your new layer.
- Click on Apply.
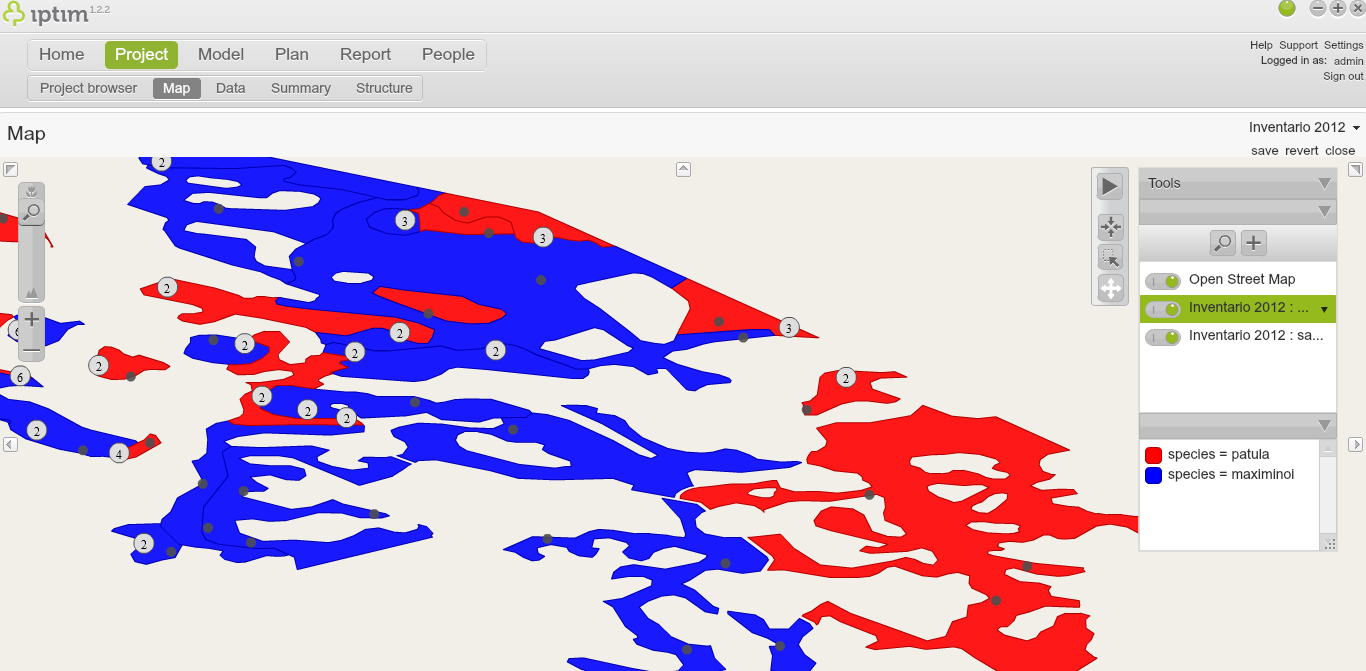
Theme layer classifying the map according to species.
__
Visualize and hide theme layers
When creating a layer, this new layer will be added under the layer corresponding to the data set. By default, a new layer will be visible. If you want to hide a theme layer:
- Click on the window Map in the module Project.
- Click on the triangle on the right-hand side of the data set layer where the new theme layer is included (see image below). This will let you visualise all the layers under the dataset layer.
- Click on the corresponding switch button to hide (or visualize) the layer.
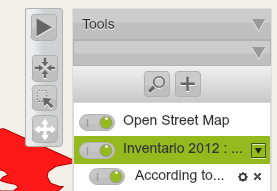
Menu to visualize/hide layers
__
Modify theme layers
To modify a theme layer:- Click on the window Map in the module Project.
- Click on the settings button (the icon has the shape of a gear; see image below). A window appears with the settings of the corresponding layer.
- Modify any setting by clicking or double-clicking on the corresponding cells.
- Click on Apply.

Comments
0 comments
Please sign in to leave a comment.